Flickr Commons continues to offer up unique treasures of graphic and information design. Today’s example is no exception.
The Chromatographic Chronicle of English History was a mid-nineteenth century text that attempted to make it easier for students to learn key historical events through graphical and numero-mnemonic means. Author R. Quinton felt that “histories—excellent in themselves—usually placed before the young student, contain such a mass of matter, that what ought to be a study, degenerates into a reading lesson,” a sentiment that rings true to anyone who has experienced the joys and agonies of studying history.
Quinton offered two solutions to this problem. The first was to use a series of colorful charts that would be easier to memorize than the dry facts alone. The second was to convert the digits of important years into mnemonic phrases. Each approach would serve to reinforce the other.
At first glance, I couldn’t make heads or tails of either approach, so I’ll let the author explain, starting with the charts:

Explanation of the Chromatographic Chart
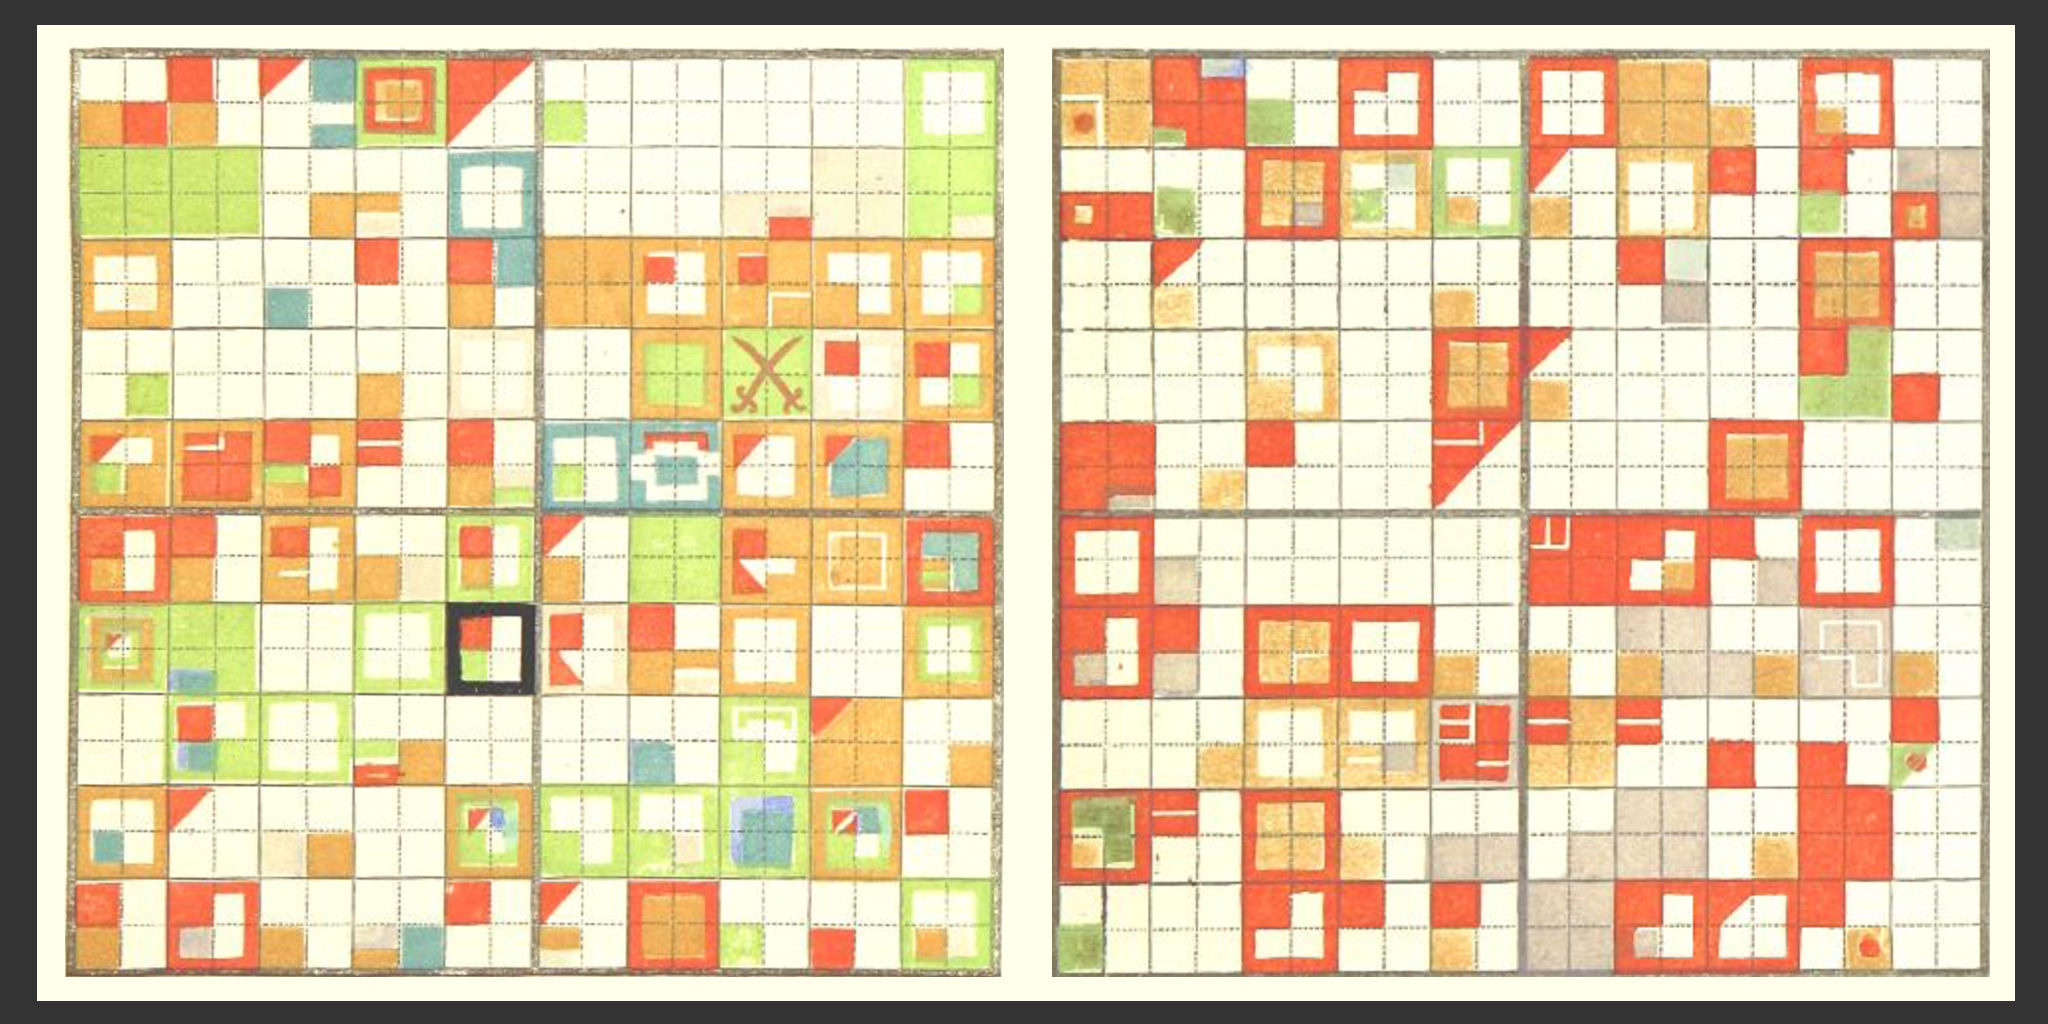
To test your newfound skills, I offer the 15th century:

Century XV
Now that you’ve mastered the graphical form, here’s the author’s explanation of each event’s mnemonic phrases:

Explanation of the Phrases
In honor of our recent holiday weekend, here’s a relevant segment from the chapter on the eighteenth century. I leave the deciphering of the key phrases as an exercise for the reader.

Events of 1775-1776
The beautiful, inscrutable graphics of The Chromatographic Chronicle of English History must have been difficult to print in great quantities. Most of the coloration appears to have been done by hand.
In case you’re curious, masochistic, or preparing for an upcoming AP History test, you can download the book in its entirety from The British Library.